
5.1 Key figures
Group
Reported, 12 months ended at 31 December, in CHF million
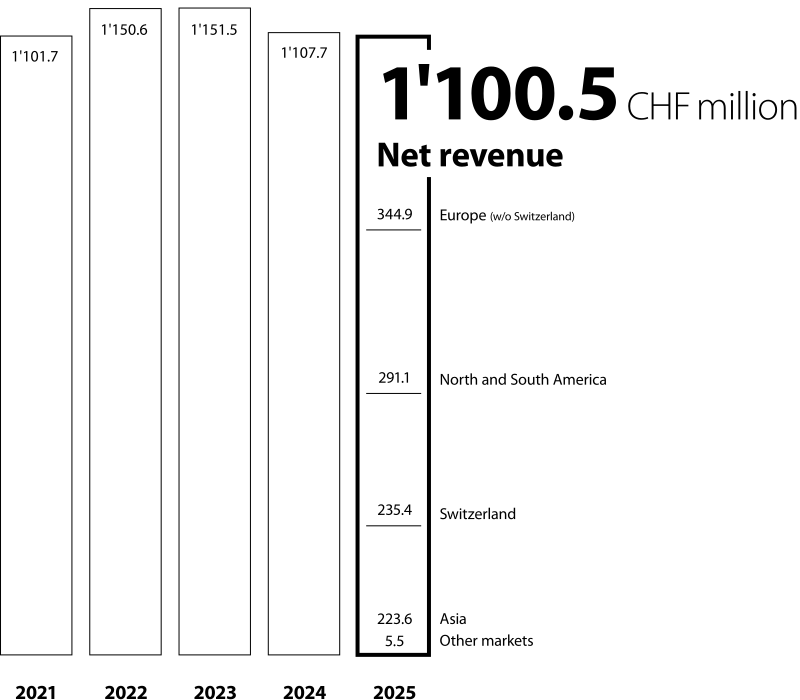
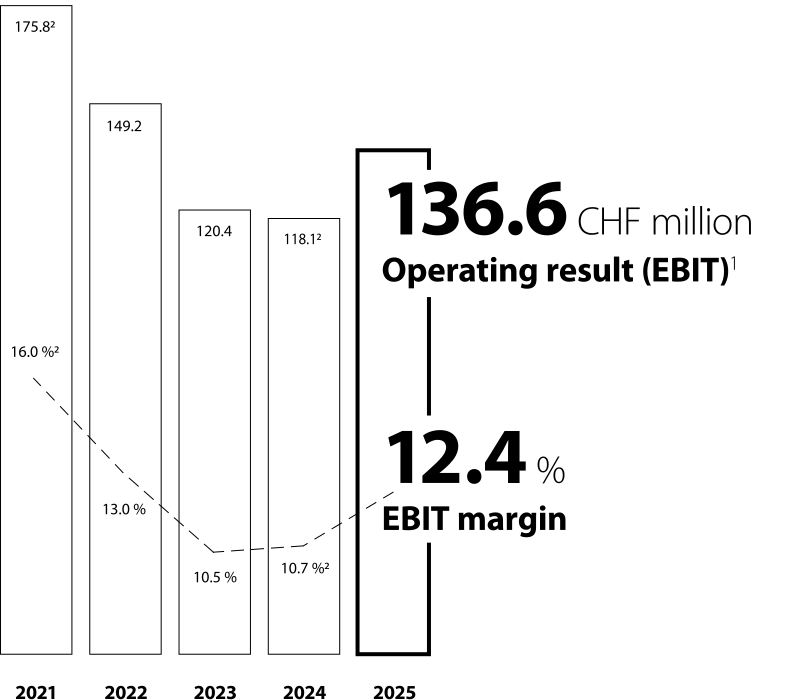
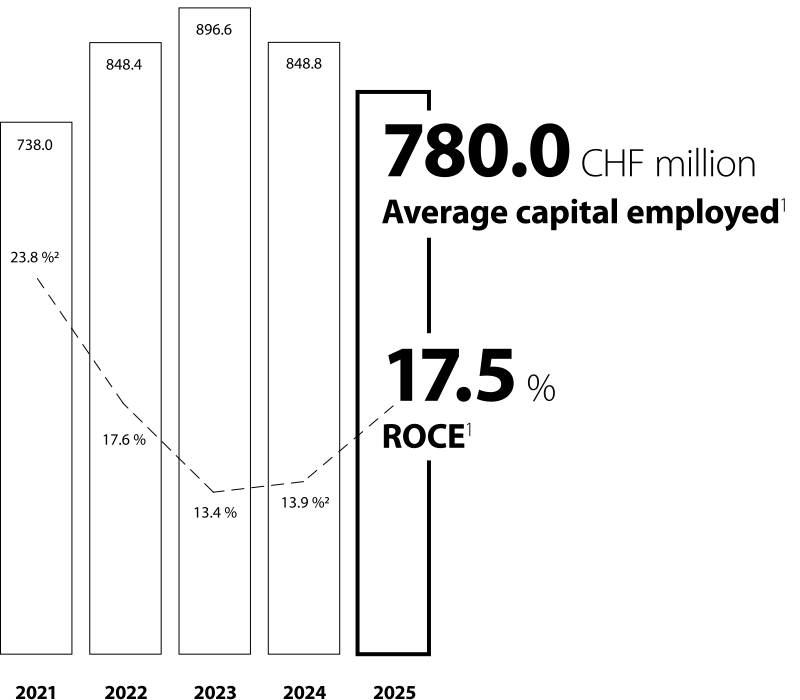
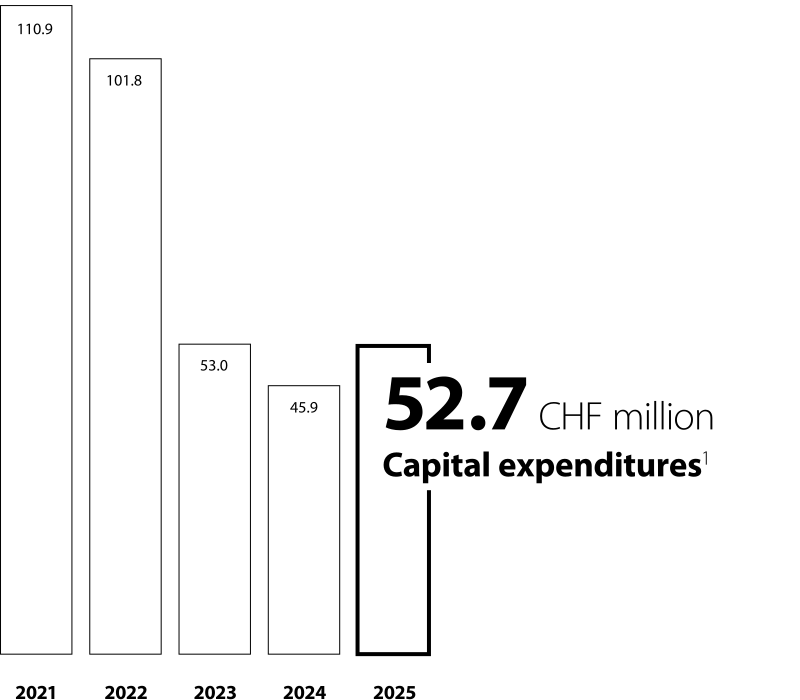
Datwyler Group uses certain financial performance measures that are not defined by Swiss GAAP. The definitions of these Alternative Performance Measures (APM) are explained in the Financial Report 2025 (pages F53–F54).
Adjusted
2025 |
2024 |
Change |
|
|---|---|---|---|
Net revenue |
1'100.5 |
1'107.7 |
–0.6 % |
EBITDA before transformation program1 |
213.7 |
199.3 |
+7.2 % |
as % of net revenue |
19.4 % |
18.0 % |
n/a |
Operating result (EBIT) before transformation program1 |
136.6 |
118.1 |
+15.7 % |
as % of net revenue (EBIT margin) |
12.4 % |
10.7 % |
n/a |
Operating result (EBIT) |
136.6 |
80.2 |
+70.3 % |
– as % of net revenue (EBIT margin) |
12.4 % |
7.2 % |
n/a |
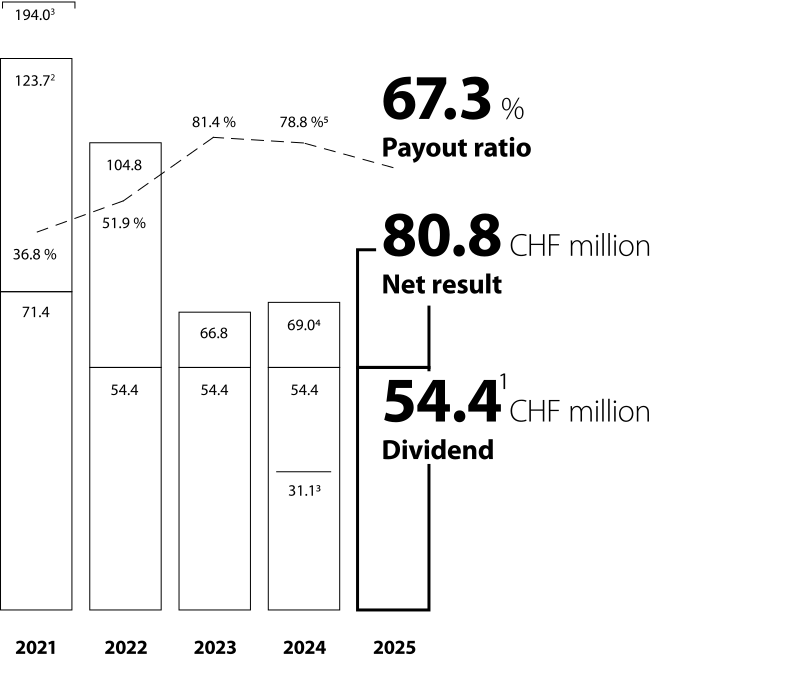
Net result |
80.8 |
31.1 |
+159.8 % |
as % of net revenue |
7.3 % |
2.8 % |
n/a |
ROCE before transformation program1 |
17.5 % |
13.9 % |
n/a |
Average capital employed1 |
780.0 |
848.8 |
–8.1 % |
Net cash from operating activities |
173.8 |
171.7 |
+1.2 % |
Net cash used in investing activities |
–44.4 |
–43.8 |
+1.4 % |
Free cash flow1 |
129.4 |
127.9 |
+1.2 % |
Net cash from financing activities |
–126.1 |
–124.9 |
+1.0 % |
Net change in cash and cash equivalents1 |
3.3 |
3.0 |
+10.0 % |
Cash, cash equivalents and money market investments |
125.5 |
127.4 |
–1.5 % |
Capital expenditures1 |
52.7 |
45.9 |
+14.8 % |
Total assets |
1'065.3 |
1'150.2 |
–7.4 % |
Equity |
369.4 |
368.5 |
+0.2 % |
as % of total assets |
34.7 % |
32.0 % |
n/a |
Number of employees at 31 December |
7'823 |
8'030 |
–2.6 % |
Full-time equivalents at 31 December |
7'633 |
7'951 |
–4.0 % |
Datwyler Group uses certain financial performance measures that are not defined by Swiss GAAP. The definitions of these Alternative Performance Measures (APM) are explained in the Financial Report 2025 (pages F53–F54)

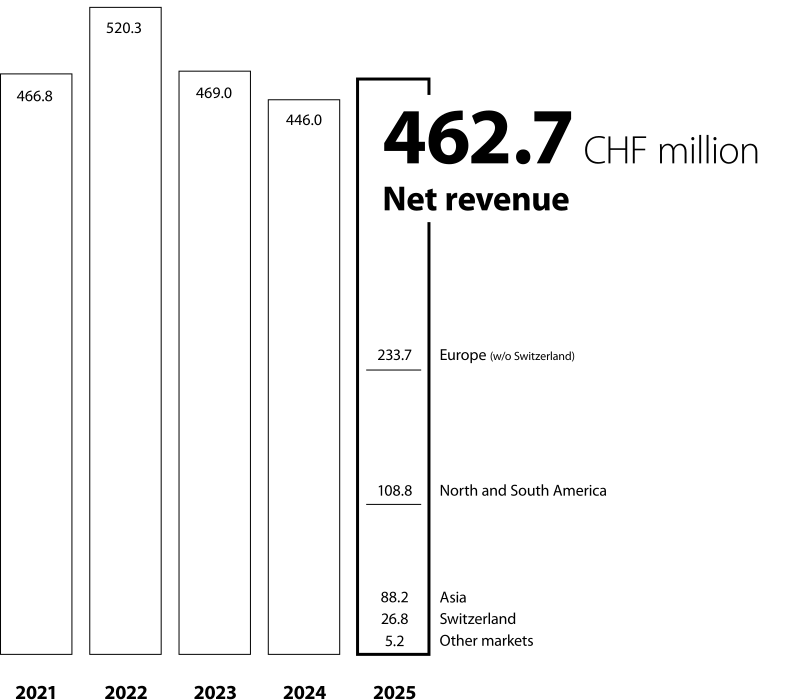
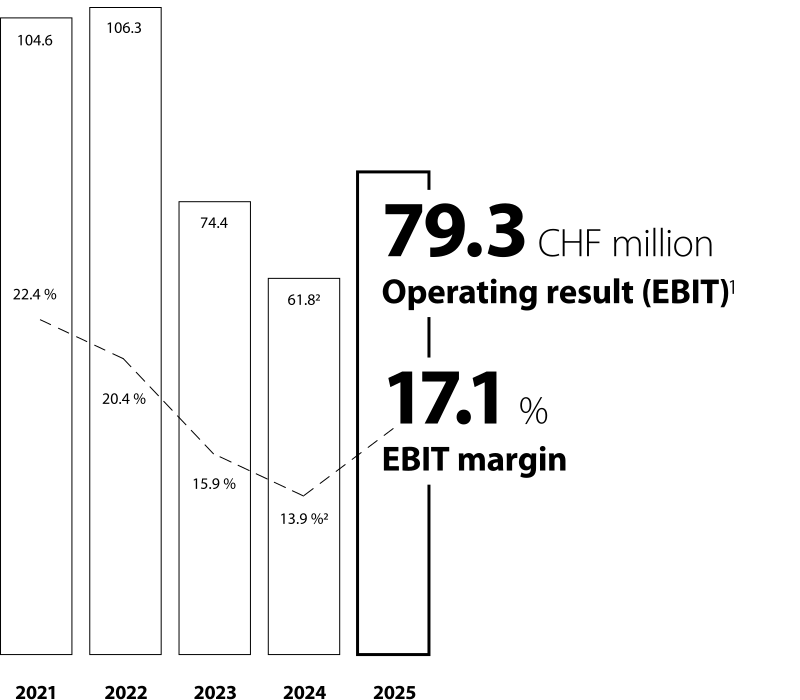
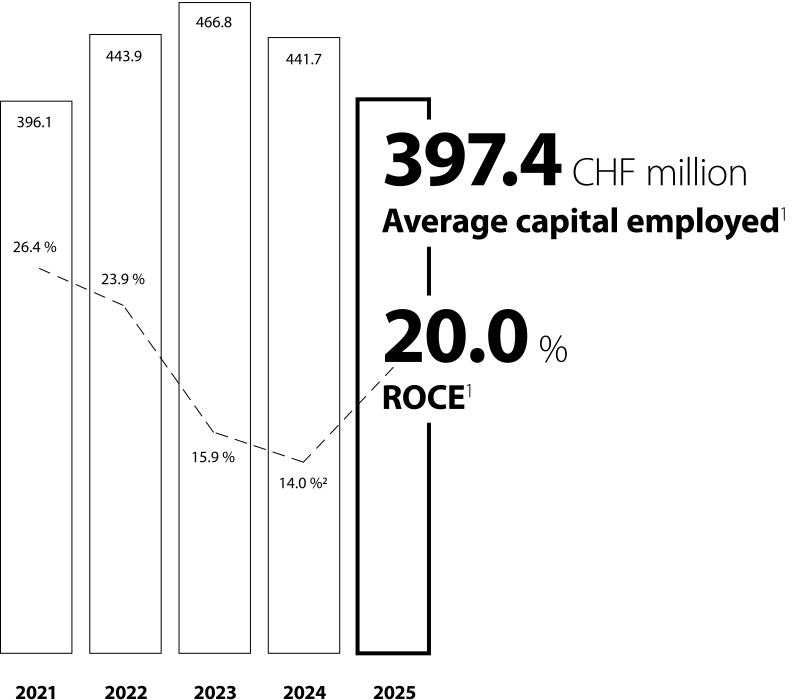
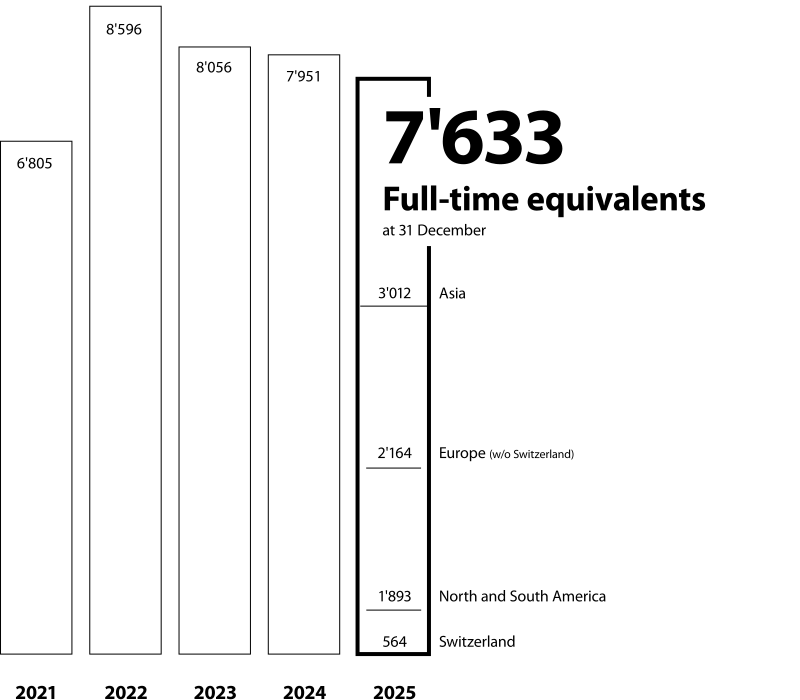
2025 |
2024 |
Change | |
|---|---|---|---|
Net revenue |
462.7 |
446.0 |
+3.7 % |
Operating result (EBIT) before transformation program1 |
79.3 |
61.8 |
+28.3 % |
as % of net revenue (EBIT margin) |
17.1 % |
13.9 % |
n/a |
ROCE before transformation program1 |
20.0 % |
14.0 % |
n/a |
Average capital employed1 |
397.4 |
441.7 |
–10.0 % |
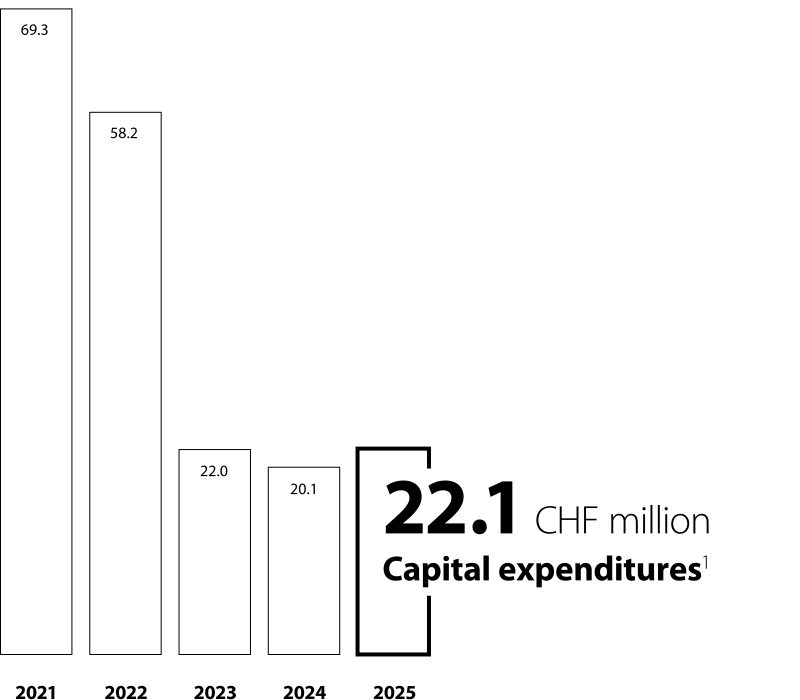
Capital expenditures1 |
22.1 |
20.1 |
+10.0 % |
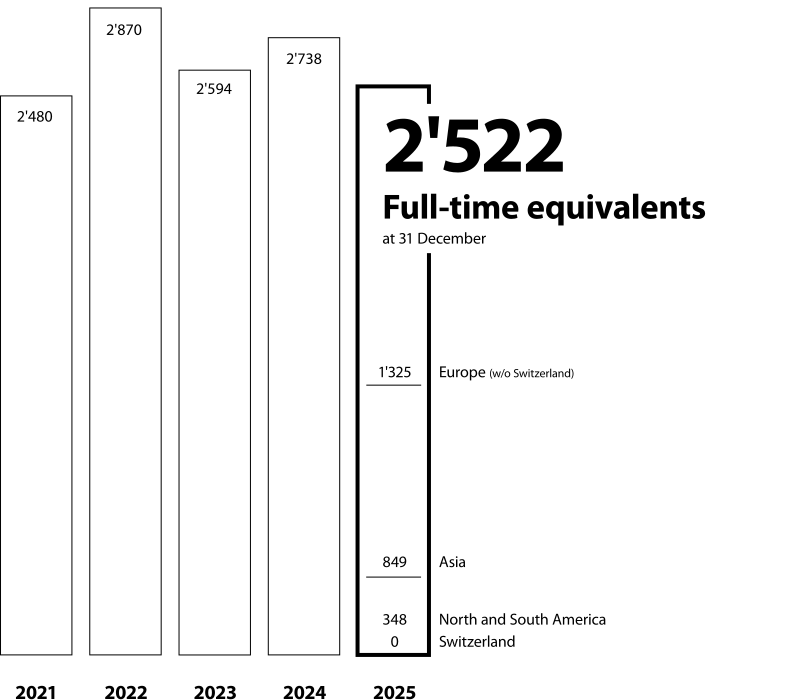
Full-time equivalents at 31 December |
2'522 |
2'738 |
–7.9 % |
Datwyler Group uses certain financial performance measures that are not defined by Swiss GAAP. The definitions of these Alternative Performance Measures (APM) are explained in the Financial Report 2025 (pages F53–F54)
2025 |
2024 |
Change | |
|---|---|---|---|
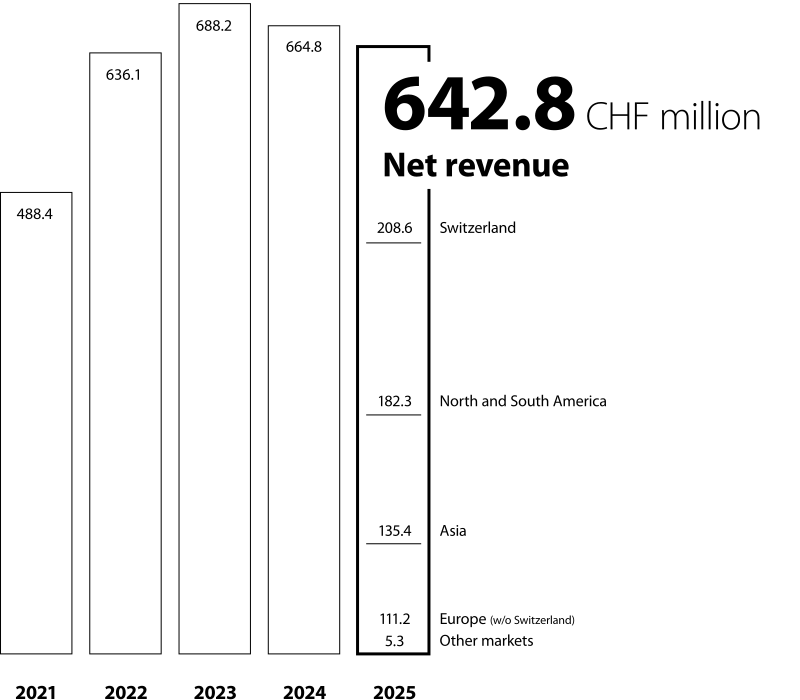
Net revenue |
642.8 |
664.8 |
–3.3 % |
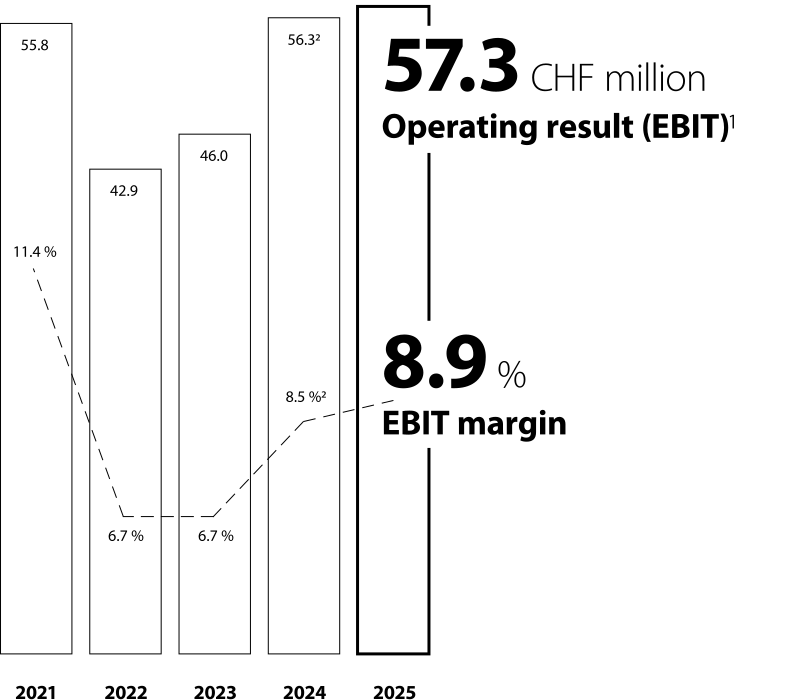
Operating result (EBIT) before transformation program1 |
57.3 |
56.3 |
+1.8 % |
as % of net revenue (EBIT margin) |
8.9 % |
8.5 % |
n/a |
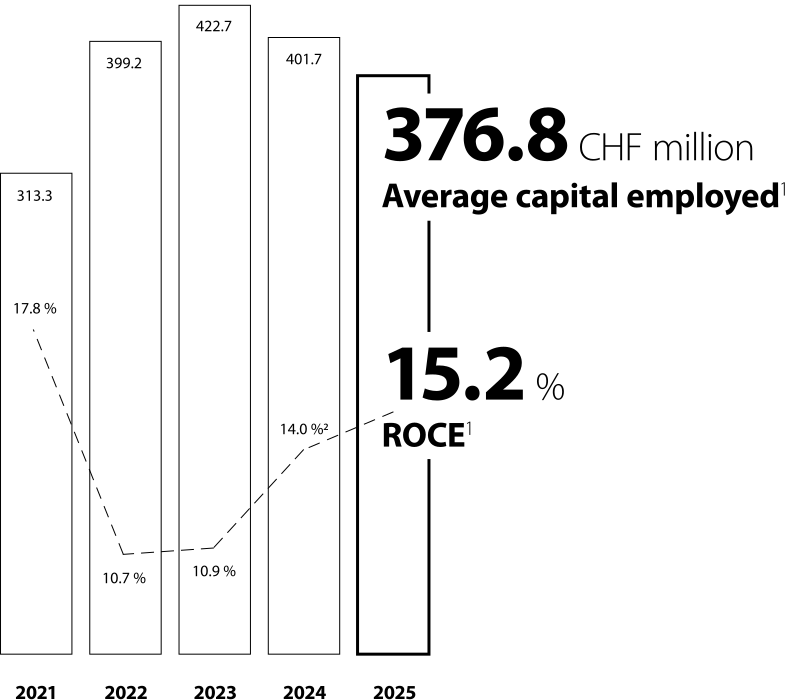
ROCE before transformation program1 |
15.2 % |
14.0 % |
n/a |
Average capital employed1 |
376.8 |
401.7 |
–6.2 % |
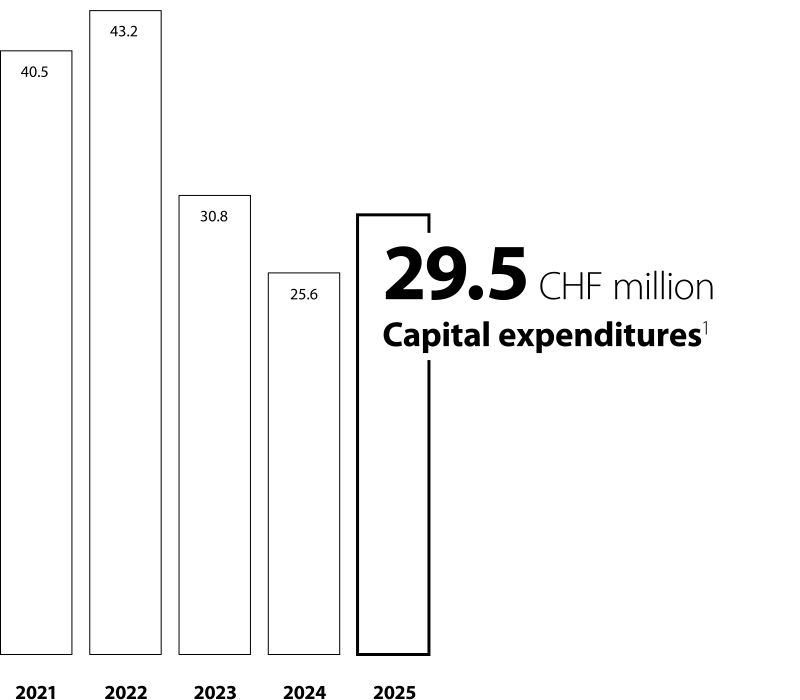
Capital expenditures1 |
29.5 |
25.6 |
+15.2 % |
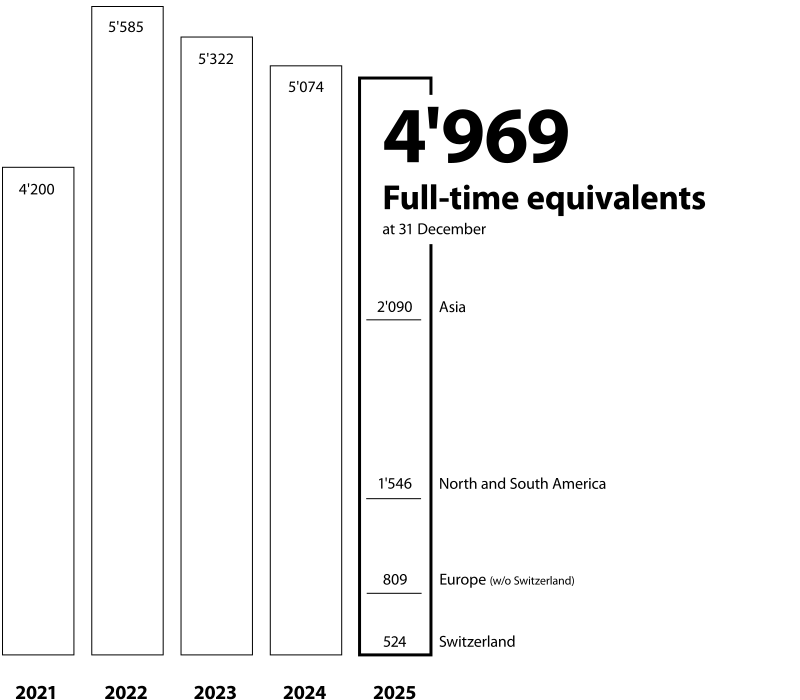
Full-time equivalents at 31 December |
4'969 |
5'074 |
–2.1 % |
Datwyler Group uses certain financial performance measures that are not defined by Swiss GAAP. The definitions of these Alternative Performance Measures (APM) are explained in the Financial Report 2025 (pages F53–F54)
| 2025 | 2024 | |
|---|---|---|
| Earnings per bearer share | 4.75 | 1.83 |
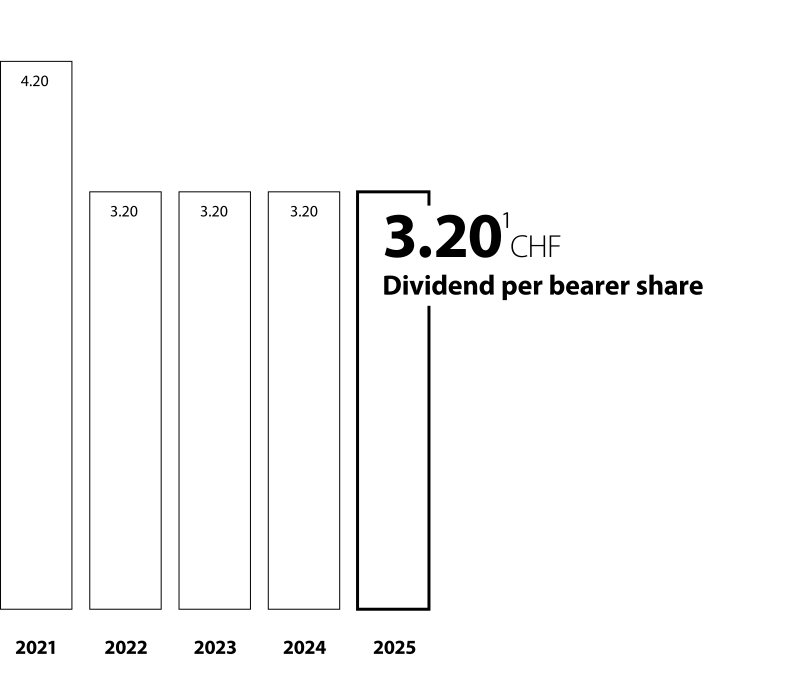
| Dividend per bearer share | 3.201 | 3.20 |
| Dividend yield at 31 December | 2.0 % | 2.4 % |
| Market price (high/low) per bearer share | 165.40 / 108.40 | 202.50 / 131.60 |
Board of Director’s proposal to the Annual General Meeting
Continuing operations
Reported net result
Net result before transformation program
In relation to the net result before transformation expensese

5.3 Consolidated
Financial Statements
Group Financial Review
Consolidated Income Statement
Consolidated Balance Sheet
Consolidated Cash Flow Statement
Consolidated Statement of Changes in Equity
Notes to the Consolidated Financial Statements
Report of the Statutory Auditor on the Consolidated Financial Statements
5.4 Financial Statements of
Dätwyler Holding Inc.
Income Statement
Balance Sheet
Notes to the Financial Statements
Proposed Appropriation of Retained Earnings
Report of the Statutory Auditor on the Financial Statements